My Journey to Understanding Crypto Markets (part 1)
DISCLAIMER
The content provided in this material is for educational purposes only. It does not constitute investment advice or recommendation. Every investor should conduct their own research (DYOR - Do Your Own Research) and make investment decisions at their own risk.
Hello! I'm glad you're here. I'm a beginner just like you. I've lost money on impulsive decisions, acted on FOMO, and made all the classic rookie mistakes. But instead of giving up, I decided to learn.
I strongly believe that in today's world, we can't ignore the crypto market. It's no longer just a niche for geeks - it's a powerful part of the global economy. Without understanding its basics, many opportunities slip through our fingers. We act reactively, making decisions based on emotions rather than analysis.
Sure, the whales probably control a significant part of the market - no one in their right mind would leave control of billions to chance. But even in this ocean, there's room for small players. We just need to learn how to swim!
For me, the best learning method is practice and immediate knowledge sharing. That's why I create these educational materials right after learning something new myself. If I could understand it, you can too! I explain everything as if I were explaining it to a 10-year-old - no jargon, just simple real-life examples.
These materials document my journey to understanding markets. I'm learning and sharing knowledge in real-time. I'm not an expert - I'm a fellow traveler. Together we can learn to analyze the market, make informed decisions, and find our place in the crypto world.
Feel free to use these materials as you wish. Learn, experiment, ask questions. Just remember - this isn't investment advice, it's sharing a learning experience.
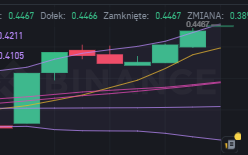
This journey begins with understanding the basics - the building blocks of technical analysis. Let's start with candlesticks and volume, the fundamental tools for reading market movements. Remember, every expert was once a beginner. The key is to start and keep learning!
"Nothing in life is to be feared, it has to be understood" - Maria Skłodowska-Curie
What is a Candlestick and How is it Formed?
Imagine watching the price of bread at a bakery for an hour. During this time, the price changes multiple times - sometimes up, sometimes down. A candlestick is a way to show all these changes in one simple image.
Each candlestick shows us four important pieces of information:
- Opening price (where we started)
- Closing price (where we ended)
- Highest price (highest point)
- Lowest price (lowest point)
Store Example:
8:00 - bread costs $2.00 (opening) 8:15 - someone raised the price to $2.20 (highest point) 8:30 - price dropped to $1.80 (lowest point) 9:00 - final price is $1.90 (closing)
Candlestick Colors and Their Meaning
- GREEN candlestick = closing price is HIGHER than opening (good news for buyers)
- RED candlestick = closing price is LOWER than opening (good news for sellers)
It's like a football match - a green candlestick means buyers won, red means sellers won.
Upper and Lower Shadows - What They Tell Us
Candlestick shadows (the thin lines extending from top and bottom) show us the extreme price points:
- Upper shadow = difference between highest price and opening/closing
- Lower shadow = difference between lowest price and opening/closing
It's like tracking temperature throughout the day:
- Highest temperature = upper shadow
- Lowest temperature = lower shadow
- Starting and ending temperature = candlestick "body"
Time Periods (Timeframes) and Their Significance
We can look at candlesticks in different time periods:
- 1 minute - like looking through a microscope
- 15 minutes - like looking up close
- 1 hour - like looking from a small hill
- 1 day - like looking from a mountain
The shorter the period, the more "noise" - it's like trying to predict weather by looking at the direction of a single leaf in the wind.
Volume - The Force Behind the Move
Volume is the number of all transactions during the candlestick period. It's like counting fans at a match:
- High volume = many people "voted" with their money
- Low volume = few people participated
Volume color always matches the candlestick color:
- Green = more people wanted to buy
- Red = more people wanted to sell
Amplitude and Change - The Difference You Need to Understand
Amplitude = maximum price range (difference between highest and lowest price) Change = actual result (difference between opening and closing)
Example:
- Opening: $100
- Highest: $120
- Lowest: $80
- Closing: $110
Amplitude = ($120 - $80) / $80 × 100% = 50% Change = ($110 - $100) / $100 × 100% = 10%
How to Analyze Charts - From General to Specific
- First look at the daily chart - see the "forest"
- Then move to 4-hour - see the "trees"
- Finally use 1-hour or 15-minute - see the "branches"
Never start with the shortest periods - it's like trying to understand a map by looking at just one house!
Market Trends
Uptrend:
- Subsequent peaks are higher
- Subsequent bottoms are higher
- More green candlesticks
Downtrend:
- Subsequent peaks are lower
- Subsequent bottoms are lower
- More red candlesticks
It's like climbing up a mountain (uptrend) or going down (downtrend).
Summary
Candlestick analysis is like learning to read - at first, we see individual letters (candlesticks), but over time we start understanding whole sentences (trends) and books (long-term market movements). The most important thing is to start with the basics and gradually build your knowledge.
Remember - every great trader started by learning the basics. Take your time, learn patiently, and always manage your risk!