


Introduction
This is the second and the last article of the series on crypto pairs trading. The first article can be found at the following link: https://medium.com/coinmonks/building-a-crypto-pairs-trading-strategy-in-python-6b1572d77344
This is the code we have written so far:
import requestsimport jsonimport pandas as pdimport datetime as dtimport numpy as np# list of about 100 tokens traded on Binancelst = ["BTC", "ETH", "CAKE", "DOT", "MANA", "SAND", "AVAX", "ALGO", "ATOM", "MATIC", "BNB","SNX", "THETA", "GRT", "LINK", "SHIB", "DOGE", "VET", "AXS", "SOL", "FIL", "TRX","FTM", "FARM", "LTC", "ETC", "NEAR", "ALICE", "ICP", "EGLD", "UNI", "ADA", "XRP","ZEC", "QUICK", "BAT", "ENJ", "GALA", "1INCH", "SLP", "COMP", "ROSE", "ONT", "AAVE","ANKR", "NEO", "XTZ", "WTC", "OCEAN", "IOTA", "IOTX", "COTI", "XLM", "QTUM", "AR","LINA", "BETA", "CELO", "ZIL", "HBAR", "OGN", "ILV", "ALPHA", "RVN", "KAVA","YGG","AUDIO", "STORJ", "ATA", "DODO", "POND", "CHZ", "YFI", "SUPER", "NKN", "INJ", "EOS","LRC", "ARPA", "LPT", "XVS", "KLAY", "CRV", "LTO", "MKR", "ONE", "RNDR","FOR", "BICO","SYS", "CELR", "ALPACA", "BLZ", "DUSK", "KNC", "PAXG", "DOCK","MBOX", "BADGER", "ZRX", "IDEX", "FIDA"]commissions = 0.01slippage = 0.001bid_ask_spread = 0.05def create_df(): pair = "USDT" root_url = 'https://api.binance.com/api/v3/klines' interval = '1d' close_prices = pd.DataFrame() for i in lst: url = root_url + '?symbol=' + i + pair + '&interval=' + interval data = json.loads(requests.get(url).text) if 'msg' in data: pass else: df = pd.DataFrame(data) df.columns = ['open_time', 'o', 'h', 'l', 'c', 'v', 'close_time', 'qav', 'num_trades', 'taker_base_vol', 'taker_quote_vol', 'ignore'] df.index = [dt.datetime.fromtimestamp(x/1000.0) for x in df.close_time] close_price = df['c'] close_prices[i] = close_price close_prices = close_prices.apply(pd.to_numeric) return close_pricesclose_prices = create_df()#close_prices4 = close_prices.iloc[0:70,]def calculate_daily_return(df): daily_return = df.pct_change(1) return daily_returndef correlations(df): # create a correlation matrix corr_matrix = df.corr() # convert our matrix into ine long column correlations_df = corr_matrix.melt() # drop the correlations with the value of 1.0 since all securities are correlated with themselves # and select the most correlated pairs correlations_df = correlations_df.loc[(correlations_df["value"] != 1.0) & (correlations_df["value"] >= 0.75)] sorted_corrs = correlations_df.sort_values(ascending=False, by="value") return sorted_corrs# select 10 most highly correlated pairsdef unique_pairs(df): # create an empty list where we'll store pairs of correlated tokens coins = [] # temporary array out = [] high_corrs_array = list(df["variable"]) for i in range(0, len(df), 2): if high_corrs_array[i] not in out and high_corrs_array[i+1] not in out: tupl = (df.iloc[i]["variable"], df.iloc[i+1]["variable"]) coins.append(tupl) out = [item for t in coins for item in t] if len(coins) == 10: break return coins
What this script does is it fetches price data from Binance, calculates daily returns of the tokens in our data, builds a correlation matrix of these returns, and selects the most highly correlated 10 coin pairs from the asset universe. These correlated pairs are upon what we develop a pairs trading strategy.
A crypto pairs trading model
First, let’s look at the code.
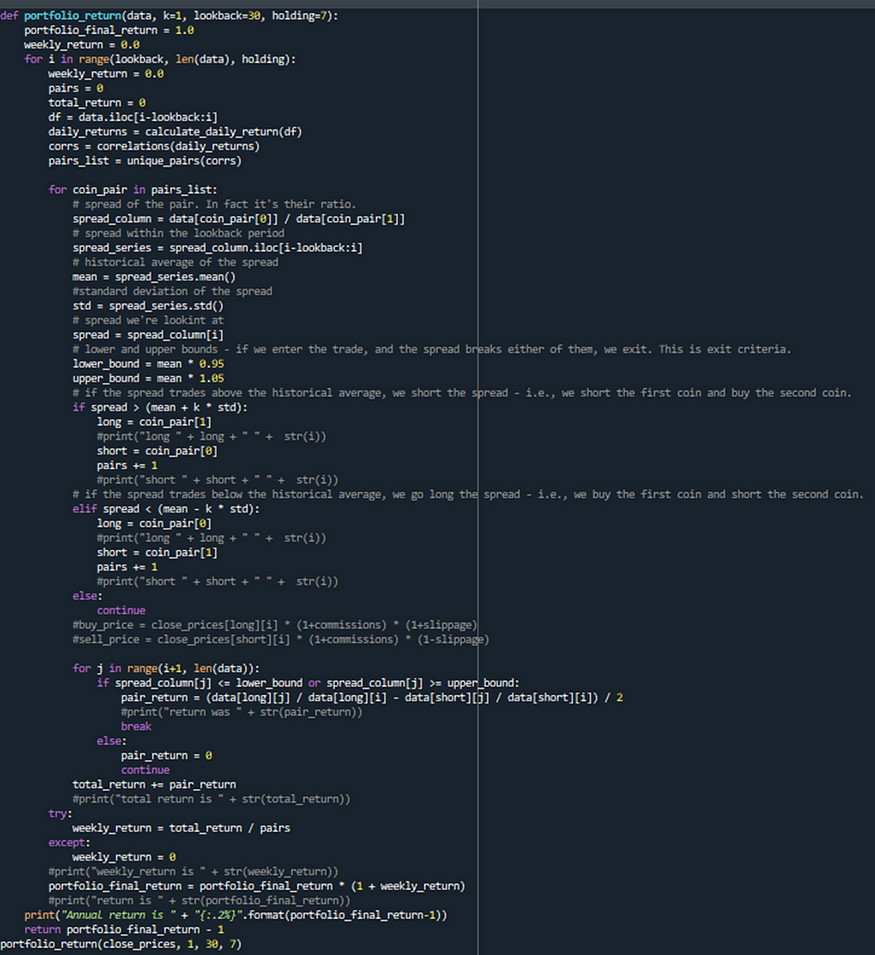
It is quite long and seems complicated. But it isn’t. Let’s go through the script line by line. The function accepts four parameters: data frame which is our data frame containing price data, k, the number which is multiplied with the standard deviation of the spread between a pair of coins — with the default value of 1. The other parameters are lookback and holding. The lookback period refers to the length of time over which past performance of an asset or a portfolio is evaluated. Holding refers to the length of time over which we hold an asset.
We’ll iterate through our data frame of close prices with a for loop. We begin at 30 because we are looking at the relationship between coins during the most recent 30 days. This is of course flexible and you can experiment with different number of days. The last value in the for loop indicates the increment value. As you probably know the default increment value in the for loop in Python is 1. So, if we want to use a different value, we have to specify it.
Next, we declare a few variables to store the results of long and short positions, and total return.
Now we can iterate through our list of coin pairs. The idea is simple. Let’s say we are at 31st row. We compute the correlation matrix for our data frame and select the coin pairs which exhibited the highest correlation within the last 30 days. Once we selected 10 pairs of coins, we check if there is a significant deviation from the average spread between two legs of the pair. Let’s say, one of the pairs in our list is (ENJ, MANA). We calculate the spread between the prices of these two coins within the most recent 30 days. On 31st day we check if the spread now is significantly higher or lower than our historical 30-day spread. If the current spread is higher, we bet that the spread will revert to its historical mean. This implies that we short the spread, i.e., we short the first coin and simultaneously long the second coin. Conversely, if the spread is significantly lower than the historical spread, we long the spread, i.e., we go long the first coin and simultaneously short the second coin.
Once there’s a deviation from the long-run average spread, we buy an underpriced coin, and short an overpriced one. We hold our positions until it hits profit target or stop loss.
How we can improve it?
This is our model. You developed a crypto trading model from scratch. But you can do more. Below is a list of some modifications which you can consider.
Some modifications that you may consider include but are not limited to:
1) Change the pair base from USDT to BTC. For example, instead of looking at the spread between ETHUSDT and DOTUSDT, we can analyse the pair of ETHBTC and DOTBTC. I think this can significantly improve the performance of the strategy. Why? Because the crypto market is a very volatile market, and the coins with USDT base can trend for a long period of time. It happens simply due to the fact that one leg of the pair is a stablecoin and doesn’t move that much. This is not desirable if we want the token pairs to revert to the mean. But if we pair the coin with BTC instead of a stablecoin like USDT, it will possibly result in a more mean-revert behaviour because in this case one leg of the pair is BTC which itself can swing significantly.
2) You can play with the value of k. It is the parameter which multiplied by standard deviation of the spread shows how the current spread has deviated from the average spread. The value of 1 will give many signals but also many false signals. The higher values will give fewer but hopefully more accurate signals.
3) You can exclude pairs where the price is expected to diverge even further. If spread < (mean — 4 * std) or spread > (mean + 4 * std), you can assume that these pairs are trending and they may not to revert to their mean. For more information, refer to # https://collective.flashbots.net/t/frp-35-pair-trading-opportunities-as-a-form-of-mev/2887
If you want to deep dive in crypto pairs trading, I wrote a brief ebook which you can buy at fmiren.gumroad.com/l/dbtak. You can get full Python code there.
I also wrote an ebook on crypto momentum trading — fmiren.gumroad.com/l/zwnkt.