
Two years ago, TVL, the number of Twitter and Discord followers and token price was the north star metric defining a project’s success.
Today, we could care less.
While these metrics still provide some insight into a project, they definitely hold less weight and importance in a slow market, and they certainly don't capture the nuanced picture of a project's overall health and long-term growth.
Instead, we’re starting to see a shift towards more granular and actionable metrics that consider individual user behavior and deeper engagement. But to be able to do this, projects must have some resemblance of a sustainable revenue model, not just through token sales or market speculation. So the fact that we’re beginning to think about new metrics is a good sign because it shows that the crypto market is slowly, but surely maturing.
Here’s my current mental model on how I view measuring web3 growth and marketing performance from a top-down vs. bottoms-up approach.
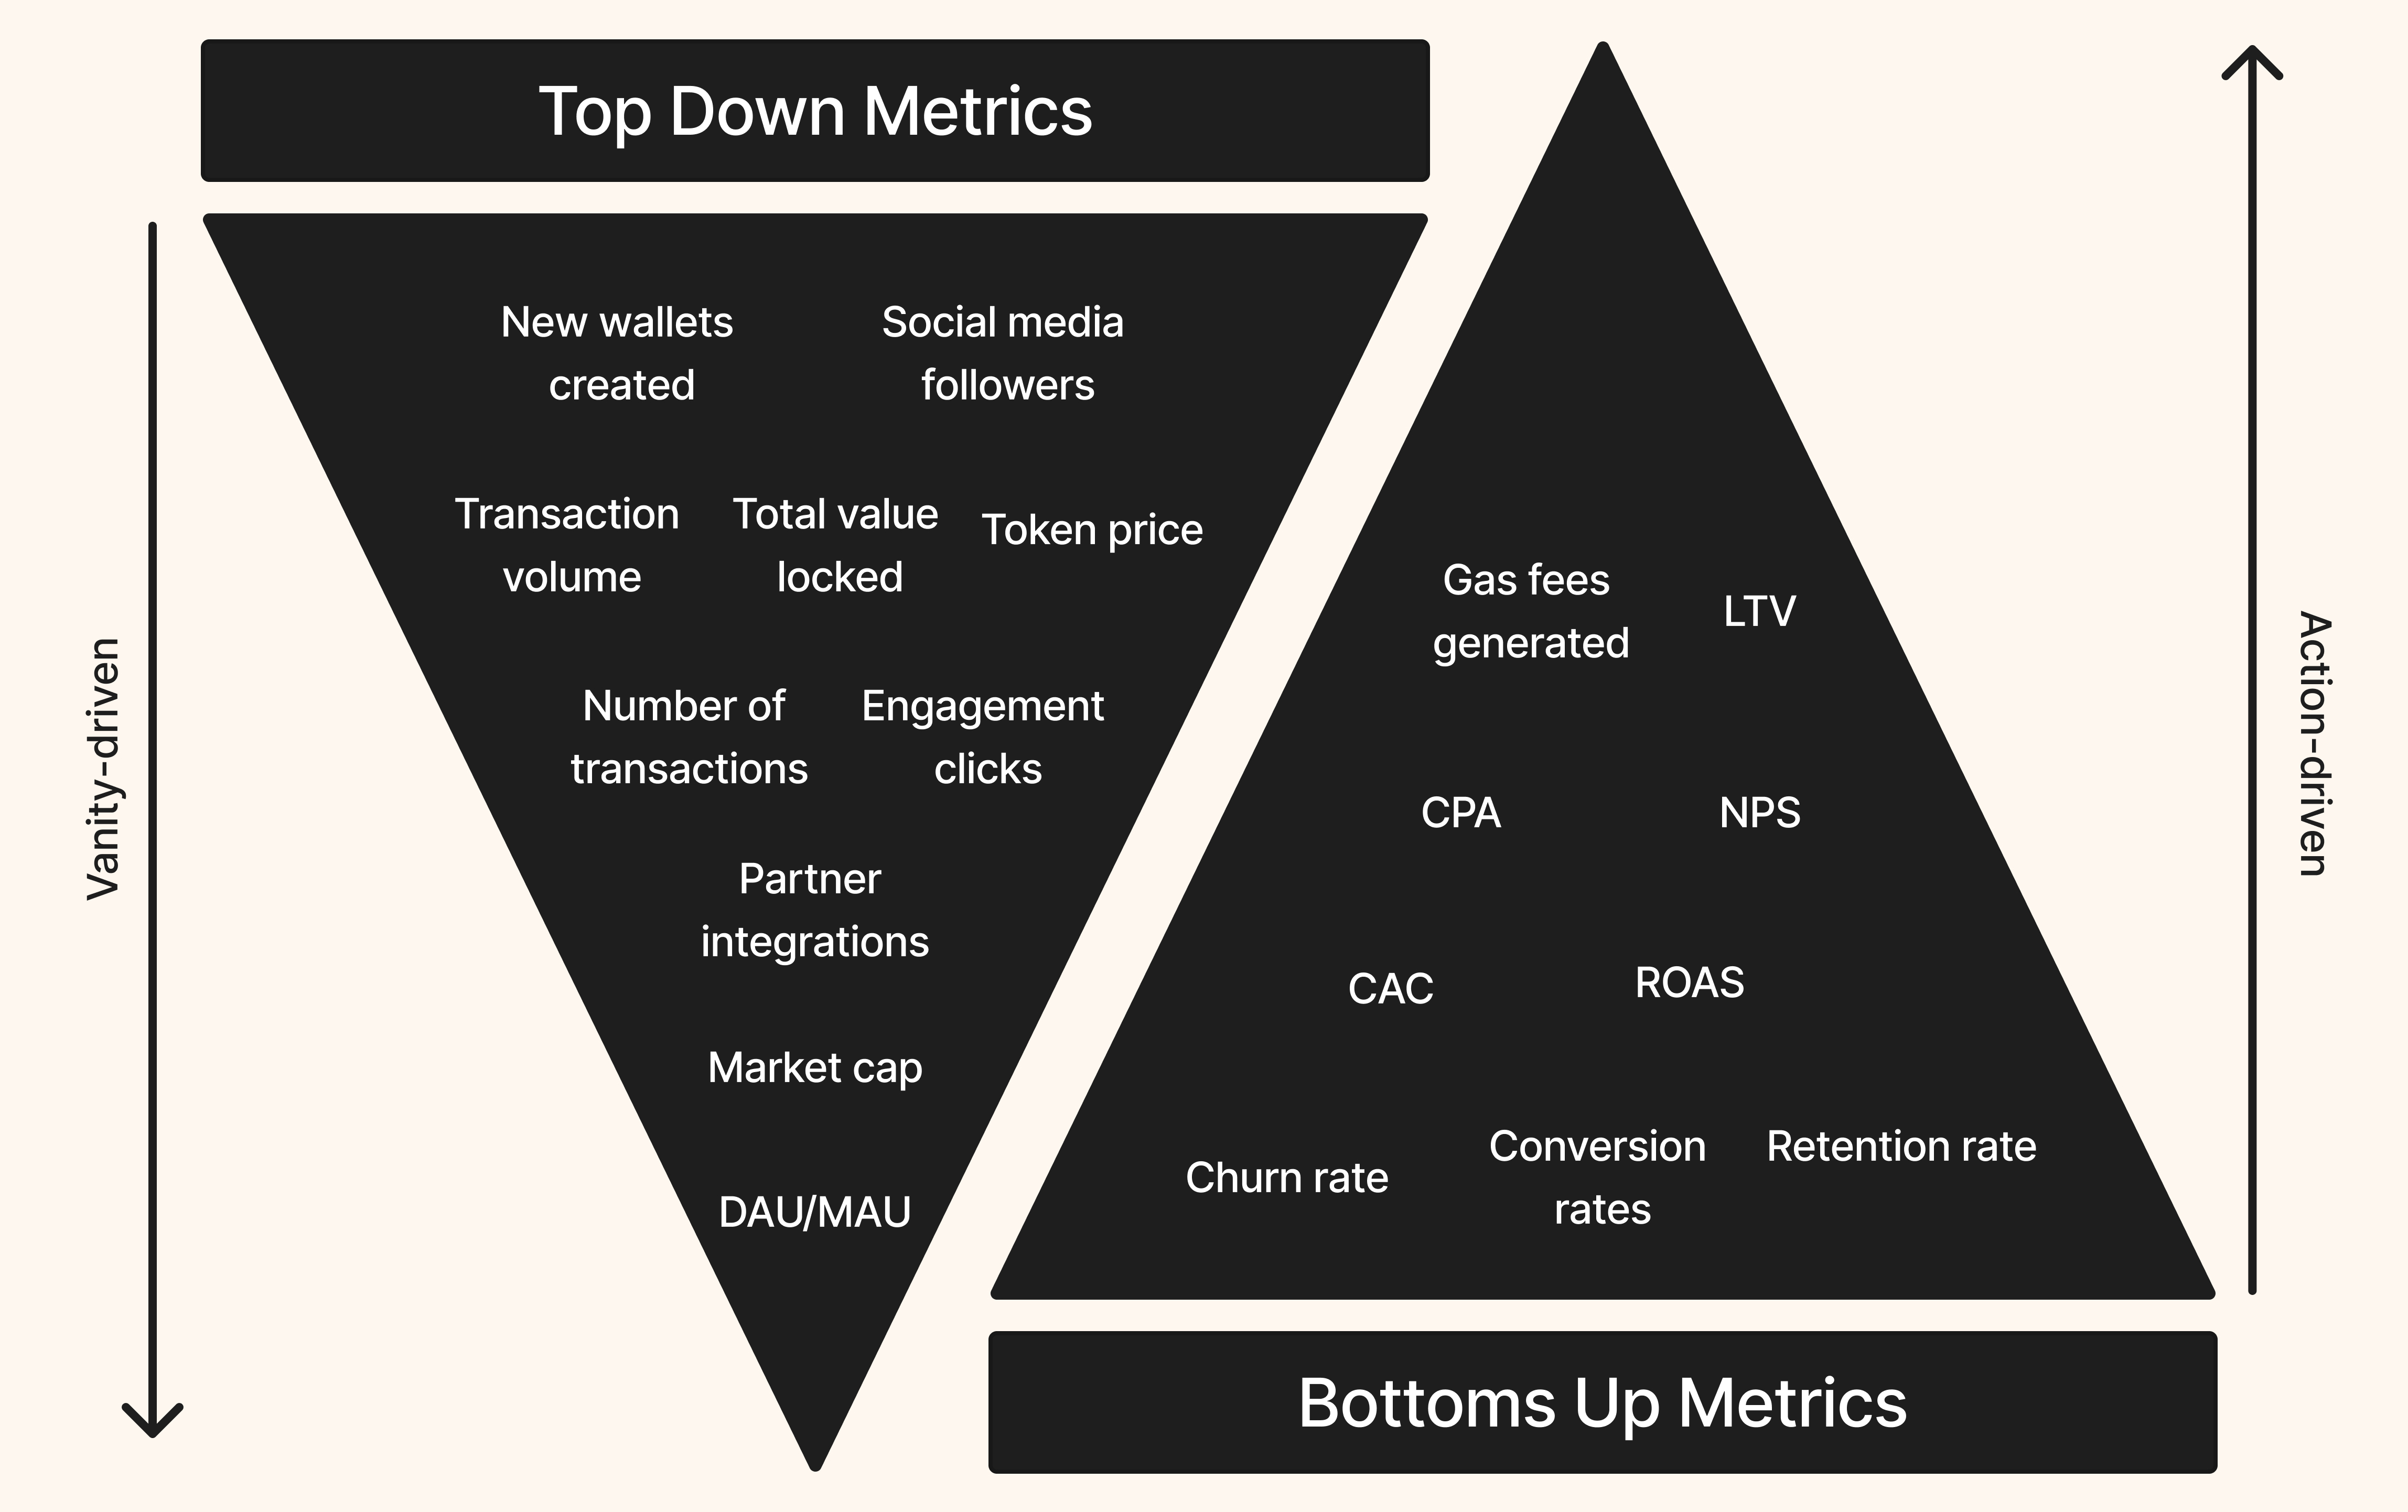
The top-down approach
Early crypto projects will typically take a top-down approach to measuring performance for several practical reasons. For one, it’s easier. It relies on aggregate data that is publicly available (TVL, token price, market cap) or simple to track (off chain metrics). The key is that these metrics are easily visible and understood by users, which can create a network effect to continue to attract and signal investors to direct liquidity to the project.
Simplicity is key in the early stages when resources are limited and the need to communicate growth to investors and the community is critical. Plus, with the anonymous nature of onchain activity, obtaining granular, user-level data and tracking is not as simple in this cookie-less world.
But while a top down approach to measuring performance is practical for an early stage project, it also drives a lot of irrational behavior to quickly boost numbers:
- Random airdrops to influential wallets
- High, but unsustainable liquidity mining or staking programs
- Artificially inflated bot trading volumes
- Flashy partnerships and sponsorships
- Excessive token burns
- Point systems
Not all crypto projects resort to unsavory marketing tactics like those, but it shows that just focusing on top-down metrics won’t paint the whole picture. It lacks the detail required to understand user behavior and engagement fully. As projects mature, there's usually a gradual shift towards more complex bottom-up analytics that can provide deeper insights into user retention, lifetime value, and other indicators that are more indicative of long-term success.
The bottoms-up approach
On the flip side, the bottom-up approach in measuring web3 growth focuses on the specifics: what each user does and the direct costs and benefits of their interactions. It’s a detailed look at individual behaviors within a project and involves metrics such as:
- User engagement: how often and in what ways users engage with a project
- Acquisition costs: the costs to bring in an active user and the value they bring to the project
- Retention and churn: how many users stick around versus how many leave the project
- Conversion rates: how many users take a desired onchain action
But to be able to get to this point, there’s more complexity to the tooling and methodology to track, segment and attribute users’ onchain actions. Plus, we add in the blend of offchain activity that happens and network bridging that makes it difficult to take a bottoms-up approach.
So how can we get to bottom funnel metrics?
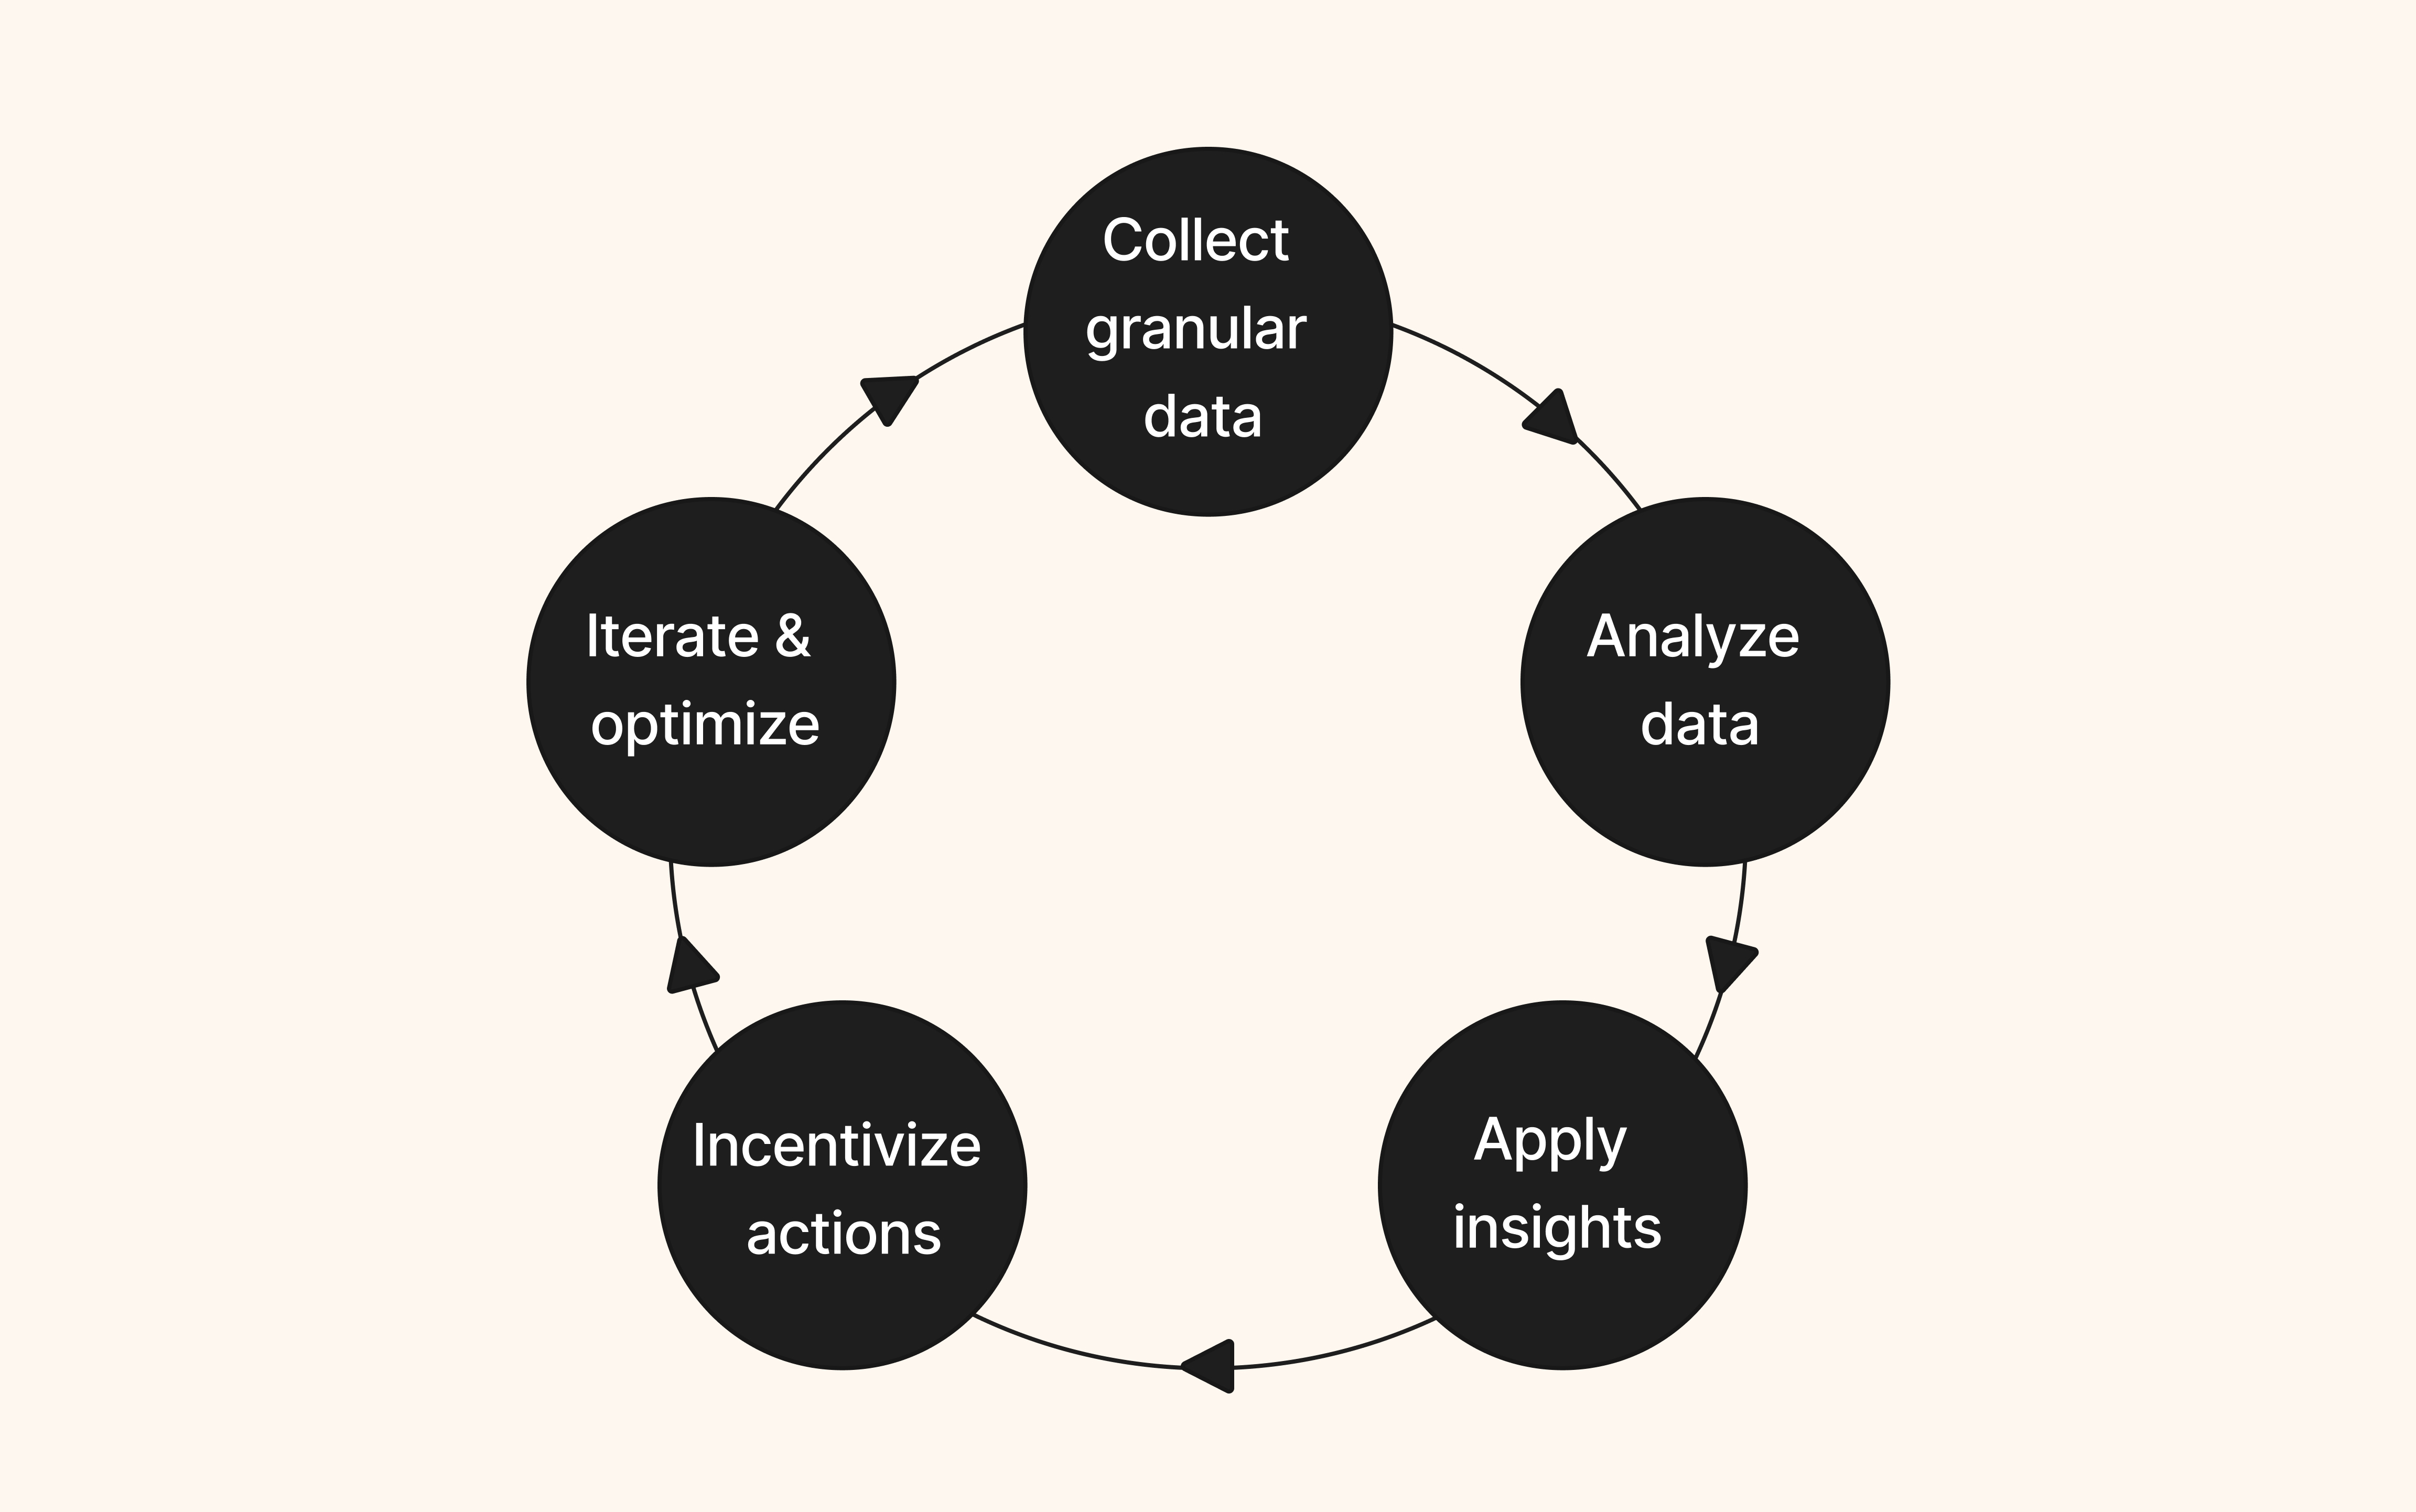
Here’s my structured way to think about how several small, iterative lifts in user behavior can power long-term growth. By looking at the data on a campaign user-level, we can incrementally gain insights on how users are interacting with the platform to optimize and drive sustainable growth.
- Collect granular data: Collect precise data by using onchain analysis tools to monitor user activity, smart contracts to log actions, and privacy-preserving identifiers to follow individual user interactions.
- Analyze data: Analyze user data by segmenting them into groups, map their journey and identify leaks, and evaluate how token usage influences their behavior.
- Apply insights: Clearly communicate insights to all stakeholders and incorporate community feedback to steer the project's direction based on data analysis.
- Incentivize desired behaviors: Automate rewards to reinforce desired behaviors.
- Continuous iteration and optimization: Continuously enhance the platform by integrating user feedback and data.
For long-term growth in web3, focusing on the details of how people use platforms (the bottom-up approach) can be more helpful. It allows projects to see what keeps users coming back and helps them make better decisions for the future.
That means that we need to implement more effective tactics to drive and measure bottom-funnel activity:
- Continuous and conditional airdrops (Quest Protocol)
- Guided or interactive quests
- Engaging web3 ads
- Referral or loyalty programs
- Incentivizing governance
Note that the common denominator in all of these tactics are incentives. But more on that another time.
Conclusion
As the web3 industry evolves, so do our methods for gauging success. Instead of relying on broad, easily skewed metrics, there's a shift towards valuing each user's contribution and fostering long-term connections. Clever, performance-driven tactics will guide projects to refine their features and engage their communities more effectively to drive long-term growth.
A slow market is the perfect time to rethink our mental models around measuring performance to help understand and answer the question: what makes a project sustainable? That is…until the next bull cycle returns.